Soybean trade was mixed. Soybeans and soyoil traded higher. Soymeal edged lower. Corn traded higher. Wheat traded lower. US stocks were higher. Crude was higher.
SOYBEANS
Soybean managed small gains. Hope that China will continue to buy US soybean and talk weekly US soybean crop ratings might drop this week due to last week’s dry Weather offered support. Trade estimates US soybean good/ex rating to be near 70 pct versus 72 last week. Talk of late week US Midwest rains and no new US China soybean sales offered resistance. Bears still feel large World 2021 supplies will eventually push soybean futures lower into the fall harvest. Analyst suggest US farmer should add to 2020 cash sales above 9.25 SX. World palmoil prices were lower. China soymeal futures were also lower. Talk of increase China hog and poultry numbers could increase their soybean import demand. US soybean prices are competitive to China Sep- Jan. Weekly US soybean exports were near 42 mil biu versus 35 last year. Season to date exports are near 1,552 mil bu versus 1,633 last year. USDA goal is 1,650 versus 1,752 last year. USDA est US 2020/21soybean exports near 2,125. .50-2.50 inches of rain could fall across the central and east Midwest later this week. Noon update was drier. FH Sep weather maps suggest normal to above rains and normal to below temps for much of the Midwest.
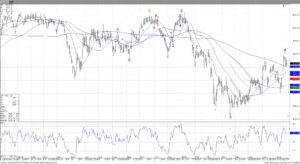
November soybean futures chart

CORN
Corn futures traded higher. Fact managed funds were bigger buyers of corn futures last week may have offered support. Some link the buying to talk USDA could drop weekly US corn crop ratings today due to last week’s dryness. Fact Iowa corn crop was damaged due to straight line winds could also drop ratings there. Most look for USDA to drop weekly US corn good/ex rating tonear 67 pct versus 69 last week. USDA estimated the crop 64 pct good/ex. Key will be rains later this week and if USDA Sep 11 crop numbers are near their August guess of 15,278 mil bu corn crop or closer to Pro farmer estimate of 14,820 mil bu corn. Weekly US corn exports were near 35 mil bu versus 25 last year. As this market year nears its end, season to date exports are near 1,624 mil bu versus 1,843 last year. USDA goal is 1,795 versus 2,066 last year. Corn futures may be also supported today by talk of lower Ukraine supplies and hope for new China buying US corn. USDA est US 2020/21 corn exports near 2,225. .50-2.50 inches of rain could fall across the central and east Midwest later this week. Noon update was drier. FH Sep weather maps suggest normal to above rains and normal to below temps for much of the Midwest. September corn futures managed to trade above last week’s high. Open interest continues to decline. Daily trade volume is lower. Corn futures are becoming overbought.
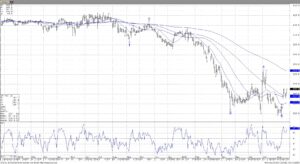
December corn futures chart

WHEAT
Wheat futures traded lower. Since April, Nearby Chicago wheat futures have managed to find supportive news near 5.00 and negative news near 5.50. Word that weekend Australia and Brazil frost did not hurt Wheat crops there and talk of Argentina rains offered resistance. French Matif futures continue to trend higher on more talk of Russia buying French wheat. The problem with wheat is that World supplies is more than adequate for demand and export demand so far is less than USDA estimate. Weekly US wheat exports were near 569 mt versus 518 last year. Season to date exports are near 6.2 mmt versus 6.0 last year. USDA goal is 26.5 mmt versus 26.3 last year. USDA estimate total World wheat trade near 188.0 mmt versus 189.0 last year. USDA continues to estimate World 2020/21 wheat end stocks near a record 317.0 mmt versus 30.9 last year. Most expect USDA to estimate US spring wheat crop rating 69 pct good/ex versus 70 last week. Spring wheat harvest is estimated near 46 pct done versus 30 last week.
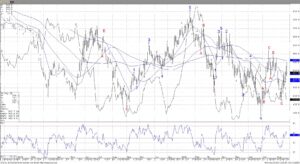
Chicago December wheat futures chart including open interest

Risk Warning: Investments in Equities, Contracts for Difference (CFDs) in any instrument, Futures, Options, Derivatives and Foreign Exchange can fluctuate in value. Investors should therefore be aware that they may not realise the initial amount invested and may incur additional liabilities. These investments may be subject to above average financial risk of loss. Investors should consider their financial circumstances, investment experience and if it is appropriate to invest. If necessary, seek independent financial advice.
ADM Investor Services International Limited, registered in England No. 2547805, is authorised and regulated by the Financial Conduct Authority [FRN 148474] and is a member of the London Stock Exchange. Registered office: 3rd Floor, The Minster Building, 21 Mincing Lane, London EC3R 7AG.
A subsidiary of Archer Daniels Midland Company.
© 2021 ADM Investor Services International Limited.
Futures and options trading involve significant risk of loss and may not be suitable for everyone. Therefore, carefully consider whether such trading is suitable for you in light of your financial condition. The information and comments contained herein is provided by ADMIS and in no way should be construed to be information provided by ADM. The author of this report did not have a financial interest in any of the contracts discussed in this report at the time the report was prepared. The information provided is designed to assist in your analysis and evaluation of the futures and options markets. However, any decisions you may make to buy, sell or hold a futures or options position on such research are entirely your own and not in any way deemed to be endorsed by or attributed to ADMIS. Copyright ADM Investor Services, Inc.
