Written Commentary
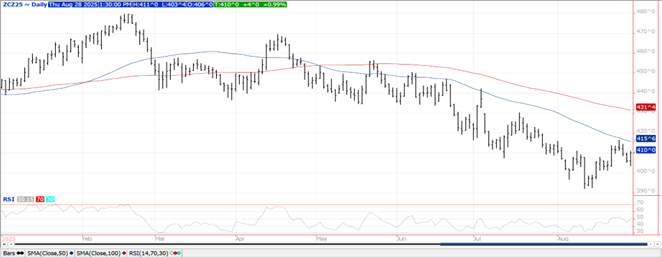
CORN
Prices rallied late to close $.03-$.04 higher making fresh highs at the close. Spreads weakened ahead of FND tomorrow as Sept/Dec carved out a new low at ($.25 ½) per bu. Still no registrations for delivery with the CME. The European Commission lowered their EU corn production est. 2.5 mmt to 57.6 mmt, in line with the USDA forecast of 58 mmt. The EC also raised their EU corn import forecast slightly to 18.8 mmt, still below the USDA forecast of 22 mmt. Stats Canada is forecasting Canadian corn production at 15.55 mmt in 2025, just above the 15.23 mmt from YA. The LSEG is forecasting US corn production at 16.320 bil. bu. 422 mil. bu. below the USDA, as they see lower acres and a lower average yield of 185.4 bpa, below the USDA est. of 188.8 bpa. Export sales at 81 mil. bu. were in line with expectations. Old crop commitments slipped to 2.774 bil. still up 26% from YA, vs. the USDA forecast of up 25%. New crop commitments jumped to 739 mil. bu., double the YA pace and the highest in 4 years. Noted buyers were Mexico – 24 mil., unknown – 20 mil. while Colombia bought 10 mil. Since 1990 the USDA has raised corn yields 18 times in the month of August. In 12 of those years final yields were below the August forecast, while 6 times it was higher. Oddly enough the last 6 times corn yields rose in August, final yields were below the August estimate by an average of 2.67 bpa.
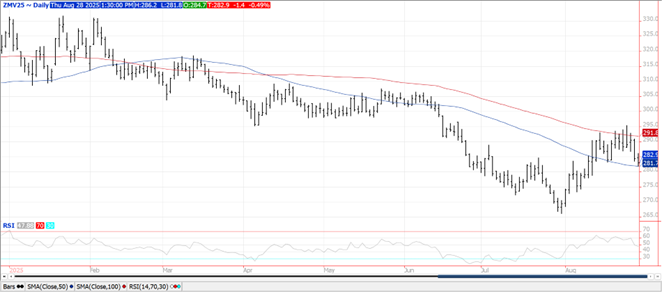
SOYBEANS
Prices were mostly lower across the complex with beans steady to $.01 higher, meals was off nearly $7 in spot Sept-25 with deferred contracts were down $1. Oil was down 75 points. Weakness was fueled by a non-threatening US weather forecast and lack of a trade deal with China. Bean spreads bounced at bit, oil spreads were mixed while nearby meal spreads crashed ahead of FND despite another 40 contracts registered for delivery being cancelled. Nov-25 beans rejected trade into new lows for the week. Oct-25 oil has support at its 100 day MA of 51.28. Oct-25 meal slipped to a fresh 2 week low however held support at its 50 day MA. Sept-25 crush margins plunged nearly $.25 bu. today ahead of FND to a 2 month low at $1.71 bu. Bean oil PV firmed a touch to 47.5%. Tomorrow we’ll get June biodiesel and RD production, capacity and feedstock usage data from the EPA. Net soybean sales at 43 mil. bu. were above expectations. Old crop commitments slipped to 1.869 bil. still up 11.6% from YA vs. the USDA forecast of up 10%. New crop commitments at 266 mil. bu. are down 29% YOY and represent only 16% of the USDA forecast, vs. the historical average of 30%. Still no sale on the books to China. Soybean meal sales at 262k tons were in line with expectations. Old crop commitments are up 13% from YA, in line with the USDA forecast. Bean oil sales at 11.4k tons (25 mil. lbs) brought old crop commitments to 2.432 bil. lbs. representing 95% of the USDA forecast. Stats Canada is forecasting 2025 canola production at 19.937 mmt, below the Ave. trade guess at 20.9 mmt, however within the range of estimates. US soybean acres in drought expanded 2% LW to 11%, matching YA.
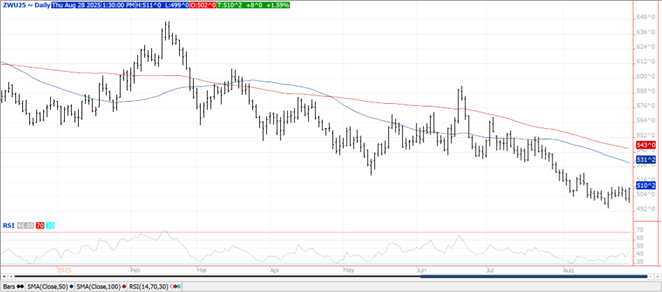
WHEAT
A late surge saw prices close in a range from $.02 to $.08 higher. Spreads firmed led a an $.08 higher close in Sept-25 CGO. New CL and 5 year low for spot KC in early weakness. Support for Sept-25 CGO is at the contract low at $4.94 ½. Argus Media raised their Russian wheat production forecast 1.3 mmt to 86.1 mmt vs. the USDA est. at 83.5 mmt. As of Aug. 27th Ukraine has harvested 3.7 mmt of grain, or which 2.26 mmt is wheat and .857 mmt is corn. Stats Canada all wheat production forecast at 35.55 mmt was slightly below the Ave. trade guess of 35.9 mmt however within the range of estimates. Their spring wheat crop is expected to reach 26 mmt, above the 25.35 mmt from YA. The USDA is forecasting Canada’s all wheat production at 35 mmt. US wheat exports at 21 mil. bu. were in line with expectations. YTD commitments at 445 mil. bu. are the highest in 5 years and up 23% from YA, vs. the USDA forecast of up 6%. By class commitments vs. the USDA forecast are: HRW up 110% vs. USDA up 38%, SRW up 6% vs. up 3%, HRS down 6.5% vs. down 4%, and white down 13% vs. down 14%.
Charts provided by QST.
Risk Warning: Investments in Equities, Contracts for Difference (CFDs) in any instrument, Futures, Options, Derivatives and Foreign Exchange can fluctuate in value. Investors should therefore be aware that they may not realise the initial amount invested and may incur additional liabilities. These investments may be subject to above average financial risk of loss. Investors should consider their financial circumstances, investment experience and if it is appropriate to invest. If necessary, seek independent financial advice.
ADM Investor Services International Limited, registered in England No. 2547805, is authorised and regulated by the Financial Conduct Authority [FRN 148474] and is a member of the London Stock Exchange. Registered office: 3rd Floor, The Minster Building, 21 Mincing Lane, London EC3R 7AG.
A subsidiary of Archer Daniels Midland Company.
© 2021 ADM Investor Services International Limited.
Futures and options trading involve significant risk of loss and may not be suitable for everyone. Therefore, carefully consider whether such trading is suitable for you in light of your financial condition. The information and comments contained herein is provided by ADMIS and in no way should be construed to be information provided by ADM. The author of this report did not have a financial interest in any of the contracts discussed in this report at the time the report was prepared. The information provided is designed to assist in your analysis and evaluation of the futures and options markets. However, any decisions you may make to buy, sell or hold a futures or options position on such research are entirely your own and not in any way deemed to be endorsed by or attributed to ADMIS. Copyright ADM Investor Services, Inc.
